— 23
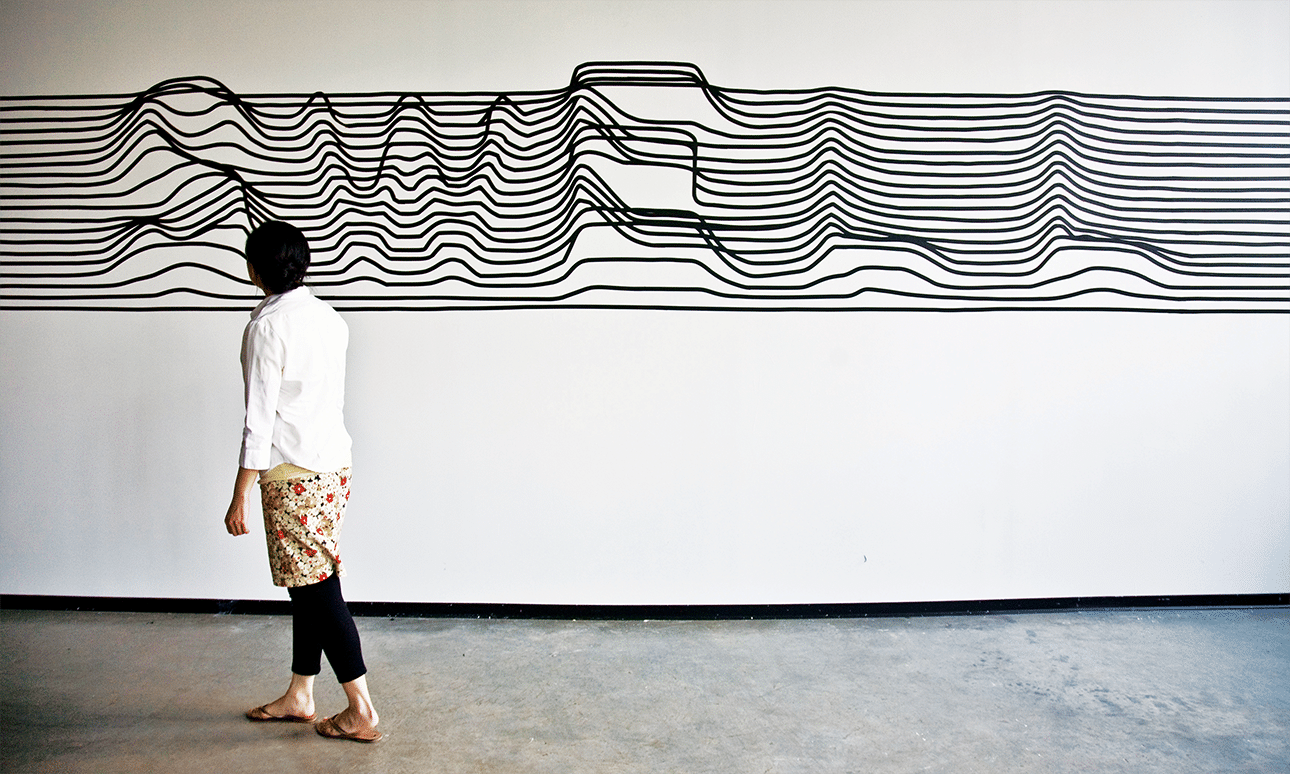
Stillspotting, Interactive Data Visualization
What is noise? How do you define it? This interactive map explores the density of noise complaints in the City of New York using 311 data.
Produced for the Guggenheim exhibition, Stillspotting, in conjunction with the Spatial Information Design Lab at Columbia University.